Simulation Results
Displacement Plot
Although SolidWorks Simulation may present these plots in very exaggerated scales of deformation, you can see I set the units to inches, the chart options to 3 decimal places, and the Max callout shows that the most deflection of the assembly under load is less than a sixteenth of an inch. Frankly, I find it hard to believe if you put 3,000 lbs on this thing, there’d be so little movement, but it’s also not as if there’s much leverage involved. This deck hugs the side of the building pretty closely.


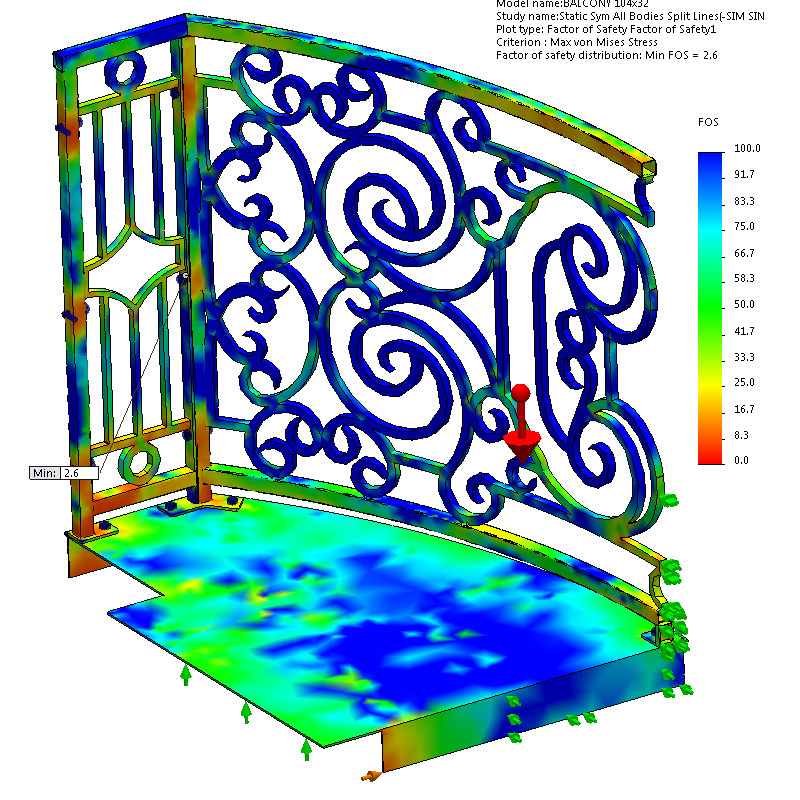
Stress Plot – Von Mises
- The stress plot shows that most areas of the assembly are not stressed. I would say, looking at this, that there are really no areas or joints that demand adding more gussetry or material thickness to stiffen it.
- According to this stress plot, the maximally stressed element isn’t even close to the yield point of the material specified (from SW materials database, “Plain Carbon Steel,” in this case).


Leave a Reply about how this blog changed your life.